
Editorial
September priced delivery risk in three stages
First escalation, then an infrastructure shock and, finally, a cautious correction
September began with a renewed rise in the geopolitical premium. At the start of the month Argus recorded only a few transits through Hormuz a day, and Platts JKM reached 25.908 USD/MMBtu. In the second week the IEA confirmed a large loss of supply and stocks, even though it lowered its oil demand forecast.
In the third week the market received a further impulse: after an attack, the Saudi East–West pipeline was shut down. The weekly Brent average then rose to 124.15 USD/b. A week later prices retreated as the number of transits increased and reports emerged of alternative routes and of the conditions for a possible reopening of the strait.
The correction did not mean a return to pre-crisis conditions. Diesel and jet fuel ended the last full week of September 16.3% and 17.1% respectively above the 24–28 August average. Europe raised its gas stocks to 71.54%, but the differences between countries remained very large.
The market lowered the premium for the worst-case scenario, but did not price in full normalisation.Editorial conclusion
Reporting period: 1–30 September 2026 · Price data: full weeks to 25 September; 28–29 September marked as partial. · Scope: crude oil, gas, LNG, distillates, aviation fuels, LPG and biofuels. · Sources: IEA, EIA, OPEC, GIE, the European Commission, IATA, EASA, Argus, S&P Global, Bloomberg and AP.
The month at a glance
Twelve numbers for September
Crude priced in the risk of disruption, but the greatest stress persisted in products and LNG, where the ability to replace lost flows was smaller.
Sources: EIA; IEA 11.09; S&P Global 3 and 21.09; GIE; IATA 29–30.09; EASA 17.09.
Retrospective · price path
Four benchmarks describe five different weeks
Crude, distillates, jet fuel and LPG did not react at the same pace
For the week of 28–30 September only the observations of 28 and 29 September were available for Brent and ULSD. For this period we do not set incomplete jet fuel and propane values against a full week.
In September the direction of prices was changed not only by news, but above all by evidence of the availability of routes and product.
We compare each week with the average of the previous week. We first give the observed prices and events, followed by a separate Danske Gas commentary identifying the most likely market mechanism.
September had three phases
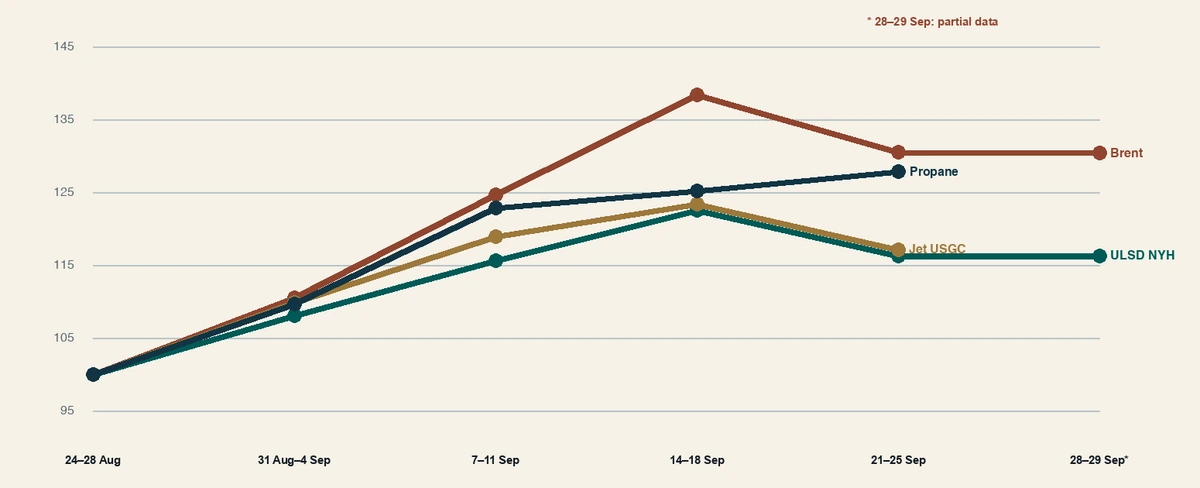
Brent accelerated for three consecutive weeks and then corrected. ULSD and jet fuel rose more slowly than crude in the peak phase, but their fall in the fourth week did not remove the product premium. Propane continued to rise even when crude began to get cheaper.
The common impulse was a transport shock, but the later divergences stemmed from local availability. Brent responded to expectations about the balance as a whole, while distillates and LPG also responded to constraints on specific export streams and on stocks.
Sources: EIA weekly spot price tables; Danske Gas calculations.
Retrospective · weeks 1–2
The first two weeks raised the premium for scarcity
The market received signals of weak traffic through Hormuz and of limited LNG supply at the same time
What changed the direction of the market
| Period | Event | Observation |
|---|---|---|
| 1–4 Sep | Hormuz | Argus: 3–9 vessels a day; JKM 25.908 USD/MMBtu |
| 6–11 Sep | Escalation and balance | new attacks; OPEC+ unchanged; IEA: stocks −95 mn bbl |
| 14–18 Sep | Infrastructure | closure of the Saudi East–West pipeline; Brent peak |
| 19–25 Sep | Flows and diplomacy | more shipments, alternative routes and a proposal to reopen Hormuz |
| 28–30 Sep | Consolidation | prices stabilise at a high level; the EU ends the month with 71.54% storage |
Week 1 · 31 August – 4 September
Brent +10.4%, ULSD +8.0%, jet +9.9% against 24–28 August
Data. Argus recorded nine transits through Hormuz on 3 September and three the following day; these levels were far from pre-war traffic. Platts JKM reached 25.908 USD/MMBtu on 2 September.
The market raised the premium for crude as well as for products and LNG, because the evidence from shipping did not confirm a lasting normalisation. In gas, an additional impulse came from competition between Europe and Asia for flexible Atlantic cargoes.
Week 2 · 7–11 September
Brent +12.9%, ULSD +7.0%, jet +8.2% against the previous week
Data. OPEC+ kept its required production for October at the September level. The IEA reported that in August global supply fell by 1.6 mn b/d month on month, and observed stocks by 95 mn barrels.
Information about weaker demand was not enough to bring prices down, because the IEA report confirmed immediate physical tightness. The absence of an additional supply impulse from OPEC+ kept attention on flows and stocks.
Sources: Argus 3–4.09; S&P Global 3.09; OPEC 6.09; IEA 11.09; EIA.
Retrospective · weeks 3–5
The third week brought the peak, the fourth a correction
The change of direction came only after flows improved and a diplomatic signal emerged
Change against the previous week
| Week | Brent | ULSD | Jet |
|---|---|---|---|
| 31 Aug – 4 Sep | +10.4% | +8.0% | +9.9% |
| 7–11 Sep | +12.9% | +7.0% | +8.2% |
| 14–18 Sep | +11.0% | +6.0% | +3.8% |
| 21–25 Sep | −5.7% | −5.1% | −5.1% |
| 28–29 Sep* | −0.1% | −0.0% | no full comparison |
Week 3 · 14–18 September
Brent +11.0%, ULSD +6.0%, jet +3.8% against the previous week
Data. After an attack the Saudi East–West pipeline was closed; according to AP, repairs were expected to take 3–5 weeks. The EIA showed distillate stocks 13% below the five-year average on 11 September.
The infrastructure shock reduced the credibility of the most important route bypassing Hormuz. Crude reacted most strongly, but low stocks and depleted export streams sustained the rise in diesel and jet fuel.
Week 4 · 21–25 September
Brent −5.7%, ULSD −5.1%, jet −5.1% against the previous week
Data. Bloomberg described an increase in shipments through Hormuz, AP pointed to alternative routes, and on 25 September a conditional proposal to reopen the strait emerged. At the same time, diesel exports from the Middle East to Europe were heading for a six-year low.
The correction was a response to the lower probability of the extreme scenario, not to a full unblocking of supply. That is why products became cheaper but remained expensive compared with the end of August.
The Brent average for 28–29 September was 116.97 USD/b and ULSD 4.9545 USD/gal – practically unchanged from the full week of 21–25 September. The lack of complete data for the whole week does not allow a symmetrical comparison of all benchmarks.
Sources: AP 14, 24 and 25.09; Bloomberg 19 and 24.09; S&P Global 21.09; EIA.
Theme of the month · Hormuz
Hormuz remains a price of time and credibility
A single successful voyage does not mean a lasting return of capacity
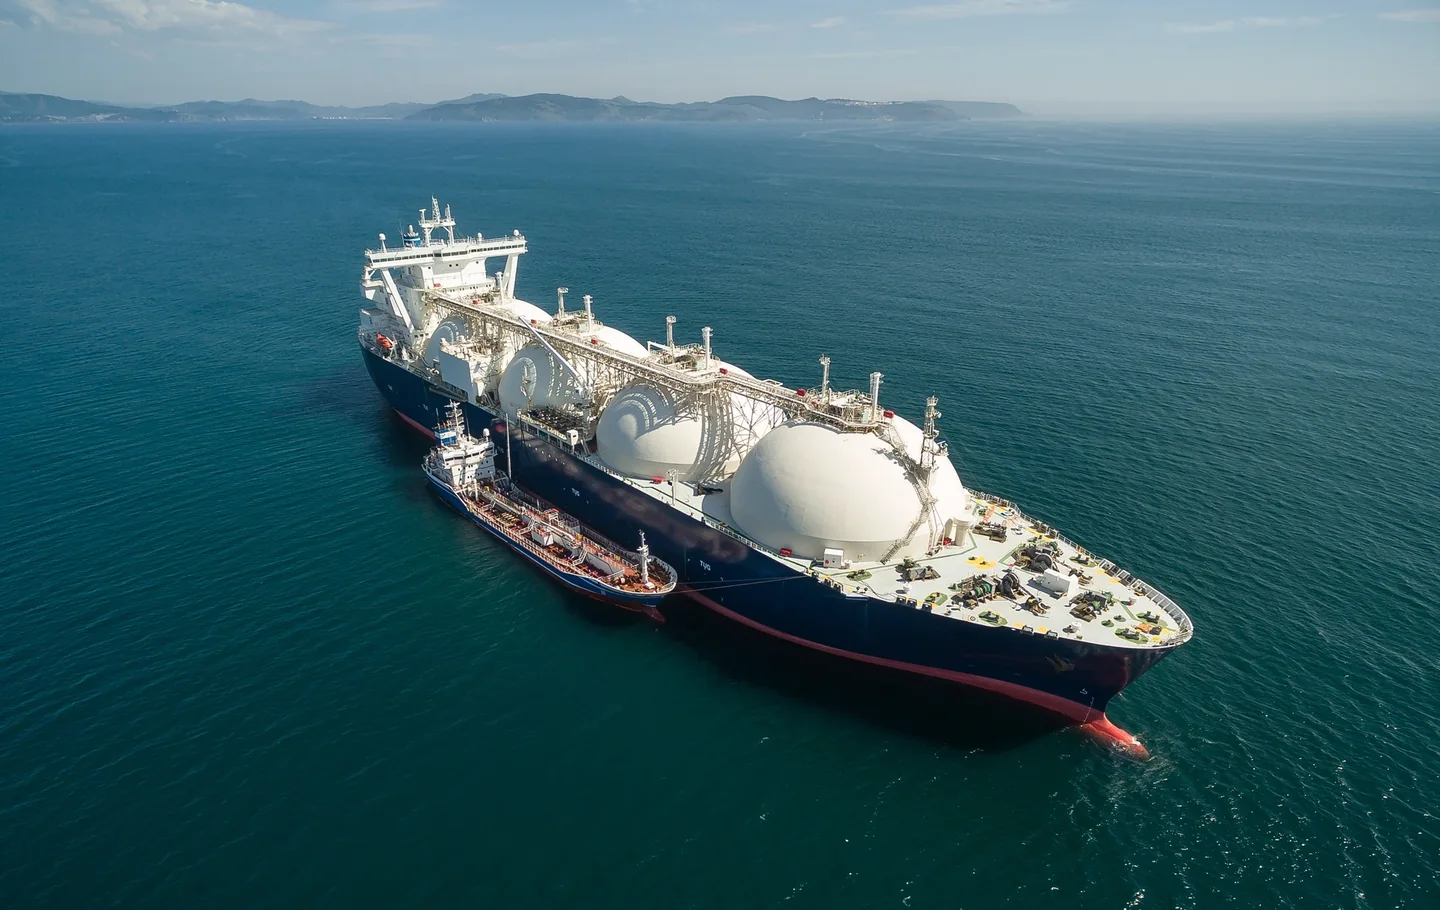
The market was pricing the difference between declared flow capacity and the actual number of safe voyages.
Argus reported that nine vessels passed through the strait on 3 September, or about 6.5% of pre-war traffic. A day later the number fell to three. The VLCC rate from the Gulf through Hormuz to Asia reached 19.39 USD/b on 2 September, 11.69 USD/b more than on the route starting in the Gulf of Oman.
In the second half of the month evidence of improvement appeared. Bloomberg quoted a US commander’s assessment of a six-month high in shipments, and AP described the use of alternative routes and workarounds. This information lowered the premium for a complete cut-off, but did not restore the pre-war certainty of supply.
The market came to believe that larger flows were possible, but not that they were fully predictable.Editorial conclusion
Cargo valuation should continue to separate the price of the commodity, freight, war-risk insurance, possible demurrage and the cost of an alternative route.
Sources: Argus 3–4.09; Bloomberg 19.09; AP 24–25.09.2026.
Crude and OPEC+
Demand is falling, but the available barrel remains expensive
The September IEA report separates a weak economy from a physical shortage

The oil balance is weak on demand but physically tight
| Indicator | Value |
|---|---|
| Forecast change in demand in 2026 | −2.5 mn b/d |
| Global supply in August | 100.1 mn b/d |
| Change in observed stocks in August | −95 mn bbl |
| Refinery runs in August | 81.4 mn b/d |
The IEA forecasts a fall in world oil demand in 2026 of 2.5 mn b/d, 940 kb/d deeper than in its August report. At the same time global supply in August fell to 100.1 mn b/d, and since February observed stocks have shrunk by a total of 507 mn barrels.
OPEC+ did not raise required output for October above the September level. This was not a declaration of lasting tightness, but a signal that the group did not want to get ahead of uncertain demand or to ignore infrastructure constraints and compensation obligations.
Weaker demand acted as a long-term limiter. In September, however, the short-term cost of lost supply and stocks dominated, which is why Brent rose despite an ever weaker consumption forecast.
Sources: IEA Oil Market Report 11.09; OPEC 6.09; EIA weekly spot prices.
Refining and distillates
Crude corrects, distillates remain expensive
Limited exports and low stocks did not allow products to return to their end-August levels

Distillates retain their premium
| Indicator | Value | Reference |
|---|---|---|
| US distillate stocks | 107.4 mn bbl | 18 Sep |
| Stock deviation | −13% | vs the five-year average; 11 Sep |
| Loss of Persian Gulf + Russia exports | 1.6 mn b/d | vs February |
| Brent | +30.5% | 21–25 Sep vs 24–28 Aug |
| ULSD NYH | +16.3% | 21–25 Sep vs 24–28 Aug |
| Jet USGC | +17.1% | 21–25 Sep vs 24–28 Aug |
| Propane | +27.8% | 21–25 Sep vs 24–28 Aug |
The IEA estimated that combined diesel and gasoil exports from the Persian Gulf and Russia were about 1.6 mn b/d lower in September than in February. S&P Global put diesel exports from the Middle East to Europe at 110 kb/d, the lowest since February 2020.
In the US, distillate stocks rose to 107.9 mn barrels in the week ending 11 September, but were still 13% below the five-year average. In the following week they fell to 107.4 mn barrels. This limited how quickly US exports could ease shortages in other regions.
Distillate requires available refining capacity, hydrogen, energy and a functioning port – not just a barrel of crude.
A formula based solely on Brent still does not describe the full cost of diesel. Separate monitoring of the crack, stocks, clean tanker freight and the availability of the delivery window is needed.
Sources: IEA 11.09; EIA WPSR; S&P Global 21.09.2026.
LNG and gas
Qatar’s absence raises the value of a flexible cargo
Europe and Asia are bidding for the same uncommitted volumes, and security rests on several layers
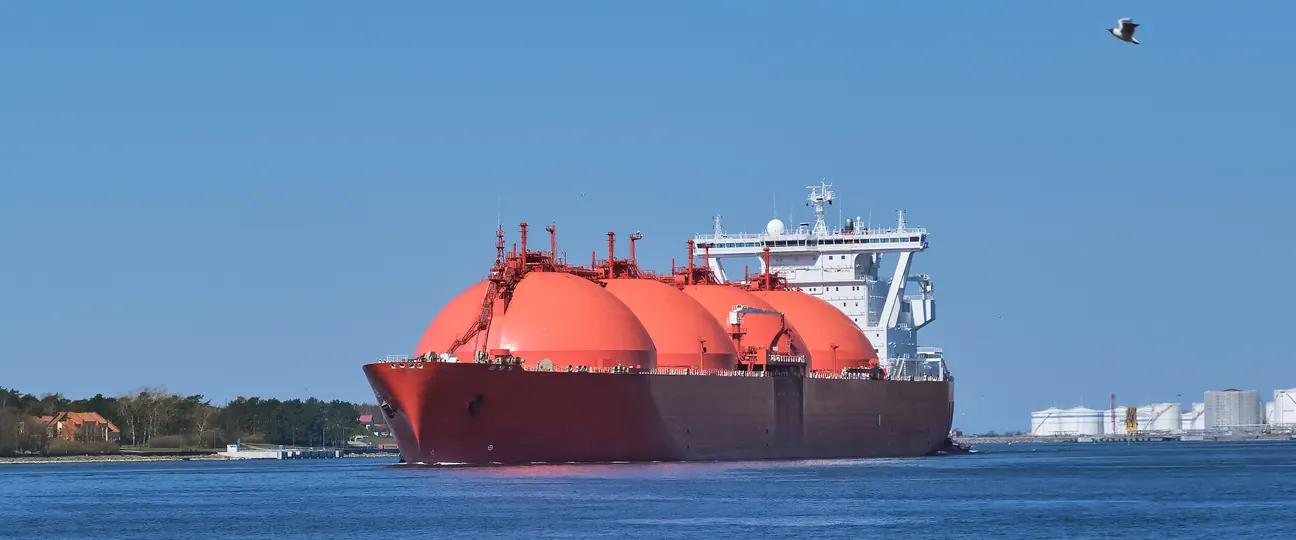
LNG: the loss of Qatar raises the value of the flexible Atlantic
| Market | Observation |
|---|---|
| JKM | 25.908 USD/MMBtu; Platts JKM, 2 September; highest since December 2022 |
| Hormuz | no LNG transits through Hormuz from 17 August to early September |
| Qatar | LNG production still offline |
| US | 16.5 Bcf/d of exports in Q3 according to the EIA |
| Europe | storage rising, but below earlier years |
| Asia | competing for the same flexible cargoes |
Platts assessed the October JKM on 2 September at 25.908 USD/MMBtu, the highest since December 2022. From 17 August to early September no LNG carrier passed through Hormuz, and Qatari production remained offline.
On 3 September the European Commission found no immediate threat to supply, pointing to diversification, LNG capacity and lower demand. The IEA proposed a broader set of tools: storage obligations, strategic gas reserves, buffer LNG stocks and flexible commercial contracts.
Gas security should not rest solely on the storage fill percentage. Contracted regasification capacity, port optionality, destination flexibility and the ability to finance a more expensive cargo also matter.
Sources: S&P Global 3.09; European Commission 3.09; IEA 9.09; EIA STEO September 2026.
EU gas storage
Storage rises to 71.54%, but unevenly
Poland ends September close to full, Germany and the Netherlands below 60%
The EU ends September 71.54% full
| Market | Storage fill |
|---|---|
| EU · 31 Aug | 65.40% |
| EU · 30 Sep | 71.54% |
| EU · change | +6.14 pp |
| Poland | 98.96% |
| Italy | 87.10% |
| France | 83.48% |
| Germany | 57.92% |
| Netherlands | 58.54% |
Between 31 August and 30 September EU storage fill rose from about 65.4% to 71.54%, an increase of 6.14 percentage points. Poland reached 98.96%, Italy 87.10% and France 83.48%. Germany stood at 57.92% and the Netherlands at 58.54%.
The rise in stocks reduced immediate sensitivity to a single cold week, but did not eliminate price risk. The lower level of the largest storage sites and the absence of Qatari LNG increase the importance of the weather, Norwegian availability and Asian competition in October.
September injections continued despite expensive LNG, which confirms the effectiveness of diversification. The price of this resilience, however, was greater dependence on more expensive spot cargoes and a regional imbalance in stocks.
Sources: GIE AGSI+ 30.09; European Commission 3.09; the previous Danske Gas issue for the starting point.
Jet fuel and aviation
Fuel costs are rising faster than air traffic
Passenger demand weakened, but the middle-distillate market kept up the pressure on airlines' costs

Fuel costs are rising faster than air traffic
| Indicator | Change | Period |
|---|---|---|
| Jet USGC | +17.1% | 21–25 Sep vs 24–28 Aug |
| Global RPK | −0.8% | August y/y |
| Cargo CTK | +4.4% | August y/y |
| Jet price according to IATA | +8.3% | August m/m |
IATA reported that global passenger traffic fell by 0.8% y/y in August, while excluding the Middle East it rose by 0.6%. Capacity increased by 0.3% and the load factor fell to 85.1%. At the same time IATA recorded a rise in the jet fuel price in August of 8.3% month on month and 79.2% year on year.
On the US spot market, the average price of US Gulf Coast jet fuel in the week of 21–25 September was 17.1% higher than in the week of 24–28 August, despite a fall of 5.1% from the peak week. Fuel thus remained a burden even after the partial correction.
Fuel hedging should take into account not only the crude price, but also the jet/diesel spread, regional basis and cargo availability risk. Weaker traffic does not guarantee a lower unit cost.
Sources: IATA 29–30.09; EIA weekly spot prices; S&P Global 21 and 24.09.
Biofuels and SAF
The first SAF threshold has been exceeded
Regulation creates demand, but record diesel margins are changing the economics of feedstocks and plants

The mandate works, but feedstock economics remain volatile
| Indicator | Value | Description |
|---|---|---|
| SAF in the EU | 2.8% | SAF share of fuel at EU airports in 2025; ReFuelEU target: 2.0% |
| ETS allowances | 5.2 mn | about EUR 430 million of support |
| BO–HO | −72 c/gal | since the start of September |
| D4 RIN | −16% | 1–18 September |
| Biodiesel | +42% | production from the start of the year to May |
| Renewable diesel | +62% | production from the start of the year to May |
EASA reported that in 2025 SAF accounted for 2.8% of fuel supplied at EU airports, above the ReFuelEU target of 2%. The European Commission granted operators 5.2 million ETS allowances worth about EUR 430 million to cover part of the cost difference.
At the same time S&P Global described a rapid deterioration in US biodiesel indicators: the BO–HO spread had fallen by more than 72 cents per gallon since the start of the month, and the value of D4 RINs by 16% between 1 and 18 September. The record ULSD margin improved the relative attractiveness of fossil fuel and changed blending incentives.
The mandate secures regulatory demand, but does not remove the risk of feedstock price, energy, environmental credit or qualification. An SAF or HVO contract should separate these components and describe the adjustment mechanism.
Sources: EASA 17.09; European Commission 15.09; S&P Global 21.09; IATA SAF.
LPG and propane
Propane keeps rising even after the crude correction
The LPG market reacts more slowly to improved shipping because it relies on specific terminals and tonnage

Propane held its gains despite the crude correction
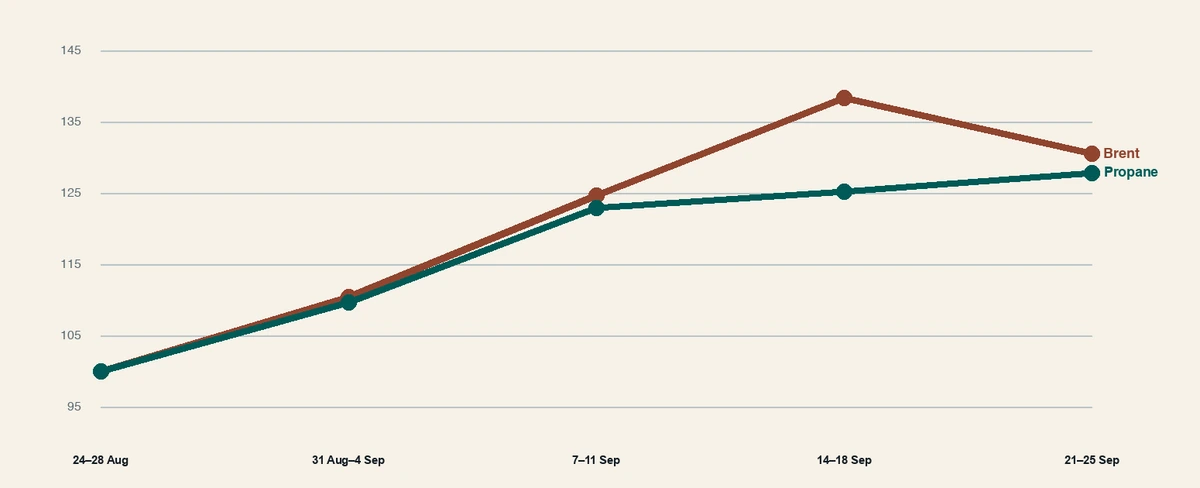
The Mont Belvieu propane price rose from 0.687 USD/gal in the week of 24–28 August to 0.878 USD/gal in the week of 21–25 September. Over the same period Brent peaked a week earlier and then fell.
The divergence is consistent with the different structure of the LPG chain: the availability of specialised VLGCs, terminal throughput, seasonal petrochemical demand and competition from Asia. Improved crude traffic through Hormuz alone need not immediately lower the cost of LPG.
Propane kept its positive momentum in the week of the crude correction. This suggests that local supply and logistics constraints remained more important than the change in the overall geopolitical premium.
Sources: EIA weekly spot prices; Danske Gas interpretation.
Regional view
Risk changes its transmission channel depending on the region
A global shock does not create a single price or a single hedge
The same shock, five transmission channels
| Region | Assessment | Source of cost |
|---|---|---|
| Persian Gulf | Critical | Hormuz throughput, infrastructure damage and the credibility of routes bypassing the strait |
| Europe | High | low stocks in the largest countries, the diesel deficit and competition for LNG |
| Asia | High | JKM, LPG, petrochemical demand and rivalry for uncommitted cargoes |
| US | Buffer | exports of LNG and products, but with tight distillate stocks |
| Atlantic | Supporting | alternative cargoes and ports at the cost of longer vessel rotation |
S&P Global pointed out that the current crisis is affecting fertilisers, sulphur, helium, diesel and jet fuel more strongly than earlier episodes. This means that energy risk passes into industry not only through the price of crude, but also through the shortage of specific by-products and energy carriers.
Sources: S&P Global 24.09; IEA; EIA; GIE; Bloomberg; AP.
The Danske Gas view
October starts with a smaller premium, but without normalisation
Five indicators will decide whether the correction holds
Do not equate the fall in Brent with a full reduction in the cost of delivered fuel. The September correction left distillate, LPG and LNG prices high and the storage buffer in Europe uneven.
- HormuzThe number and regularity of actual transits, not declared capacity.
- DieselExports from the Gulf and Russia, US stocks and the crack in Europe.
- GasThe pace of EU injections, Norwegian availability and JKM–TTF competition for the Atlantic.
- AviationThe jet/diesel spread and airlines' ability to pass costs on to fares.
- BiofuelsBO–HO, D4 RIN, waste feedstock prices and the cost of qualifying emission reductions.
Three scenarios for October
Brent stabilises below its peak; diesel, LPG and LNG keep part of their premium.
Regular voyages and repair of the bypass lower freight, cracks and JKM.
Brent reacts first, and the largest percentage move returns to products and gas.
The most valuable option for October remains the ability to change port, route and delivery date.
Sources: Danske Gas scenarios and priorities based on the sources for the whole issue.
Sources and methodology
Register of sources and retrospective methodology
Material titles are live links to the source pages
Register of sources · markets and balances
Register of sources · flows and regulation
Retrospective methodology
Weekly comparison. For Brent, WTI, ULSD, jet fuel and propane we use unweighted averages of daily closing prices published by the EIA. Each full week is compared with the immediately preceding full week.
Partial data. The week of 28–30 September covers the Brent and ULSD quotations of 28 and 29 September available at the issue’s cut-off. We do not use it for a full comparison of all markets.
Causal commentary. We identify the mechanism that best fits the sequence of events and the price reaction. This is a Danske Gas synthesis, not a statement by any single source about the sole cause of a move.
Limitations. The report contains no licensed PRA series and does not replace transaction data. All scenarios are conditional and informational in character, not investment, tax or legal advice.