

Editorial
In October the energy markets parted ways
Crude closed the month relatively steady, but LPG, LNG and distillates kept their own premiums
Brent ended October at 120.15 USD/b, 4.6% above its level on 1 October, but prices moved abruptly: by 2 October the price had already risen to 135.51 USD/b. The monthly average was 123.93 USD/b. WTI remained considerably cheaper, and the average Brent–WTI price spread reached 21.86 USD/b.
The products market was tighter than the crude market. US distillate stocks fell to 99.259 mn barrels, below 100 mn for the first time since 2003. ULSD reached its highest average in the week of 19–23 October, when Brent was already below its average for the first half of the month.
The gas market sent two opposite signals. Between 1 and 30 October the Henry Hub spot price fell by 19.3%, to 2.42 USD/MMBtu. Meanwhile, ACER’s assessment of the European LNG price rose by 39.4%, to 97.170 EUR/MWh, and at the end of the month JKM and TTF converged at about 34 USD/MMBtu.
LPG kept its own momentum. The Mont Belvieu propane price rose by 41.4%, and between 2 and 30 October propane and propylene stocks shrank by 3.738 mn barrels. Such a strong divergence from crude justifies separate monitoring of VLGC freight, exports and petrochemical demand.
In October, the value of a cargo was decided not only by the price of the commodity, but also by the route and the cost of time.
A trader should first identify the bottleneck, and only then choose the benchmark.Editorial conclusion
In the account of each week the data are separated from the retrospective commentary. The arbitrage assessment shows where there was a price-difference signal or a confirmed flow, but it does not replace a current netback calculation or checks of quality, sanctions and vessel availability.
Reporting period: 1–31 October 2026 · Retrospective: five calendar weeks; the first week is shortened. · Arbitrage: an initial assessment, taking account of costs and delivery constraints.
The month at a glance
Twelve numbers for October
October rewarded the freedom to choose a region. Cheap gas in the US did not automatically lower the price of LNG in Europe, and the availability of crude did not guarantee the availability of diesel, LPG or jet fuel.
Sources: EIA, IEA, ACER, GIE, JOGMEC, EPA. Danske Gas calculations.
Price path and chronology
The same month, different directions
Propane and European LNG rose, Henry Hub fell, and crude ended the month without a new trend
October split five markets
What changed the market in October
| Period | Event | Observation |
|---|---|---|
| 1–4 Oct | Stocks and OPEC+ | G7: 100 mn bbl; OPEC+ with no additional quota for November |
| 5–11 Oct | Isaias and diesel | Gulf of Mexico shut-ins; DOE exchanges up to 4 mn bbl; IEA appeal |
| 12–16 Oct | Balance and RFS | IEA: diesel remains tight; EPA proposes a correction to the SRE reallocation |
| 19–23 Oct | Winter in LNG | JKM exceeds 30 USD/MMBtu; Europe ends the week with storage 74.6% full |
| 26–30 Oct | Convergence | JKM and TTF about 34 USD/MMBtu; US distillates below 100 mn bbl |
The greatest divergence occurred between European LNG and propane on the one hand and US gas on the other. Brent and ULSD were more stable from the start to the end of the month, but along the way they passed through distinctly different weekly phases.
Sources: EIA; ACER; G7; OPEC; IEA; DOE; EPA; GIE; JOGMEC.
Retrospective · weeks 1–2
The first impulse came from stock policy and supply risk
Week 1 is shortened; week 2 covers a full five days
Five weeks – seven different paths
| Market | 1–2* | 5–9 | 12–16 | 19–23 | 26–30 |
|---|---|---|---|---|---|
| Brent · USD/b | 125.2 | 127.4 | 125.6 | 121.0 | 121.2 |
| WTI · USD/b | 98.8 | 96.9 | 99.9 | 107.2 | 105.6 |
| ULSD · USD/gal | 4.712 | 4.911 | 5.027 | 5.201 | 4.757 |
| Jet · USD/gal | 4.331 | 4.405 | 4.500 | 4.623 | 4.464 |
| Propane · USD/gal | 0.914 | 0.957 | 1.067 | 1.123 | 1.163 |
| Henry Hub · USD/MMBtu | 2.95 | 3.10 | 3.20 | 3.02 | 2.65 |
| EU LNG · EUR/MWh | 70.2 | 73.7 | 80.4 | 84.7 | 92.5 |
Week 1 · 1–2 October
Brent 125.17 USD/b; propane 0.914 USD/gal; EU LNG 70.23 EUR/MWh
The G7 announced 100 mn barrels of coordinated releases over four months, with a significant share of diesel at the start of the programme. On 2 October Brent reached 135.51 USD/b. On 4 October OPEC+ did not increase the required production level for November.
A short week does not allow a like-for-like comparison. From a trader’s perspective, the most important thing was to separate the effect of the stock announcement from the absence of a new OPEC+ commitment. The intervention reduced availability risk over time, but did not immediately improve refinery runs or freight.
Week 2 · 5–9 October
Brent +1.8%; ULSD +4.2%; propane +4.7%; EU LNG +5.0% against the short week
The EIA published its STEO on 6 October, and on 7 October the IEA called for faster implementation of earlier releases. Hurricane Isaias curtailed output in the Gulf of Mexico; according to BSEE, 62.89% of offshore crude output was shut in on 8 October.
Products and gas reacted more strongly than Brent itself, because the market was pricing specific availability. In retrospect, the cost of delivered product was a better indicator of tightness than the direction of crude alone.
Sources: G7 2.10; OPEC 4.10; EIA 6 and 9.10; IEA 7.10; BSEE 8.10.
Retrospective · weeks 3–4
Distillates and LNG took the lead
Crude was getting cheaper, but the physical product and gas markets remained tight
In October, the margin depended on the availability of specific fractions and on logistics, not only on the price of the feedstock.
Week 3 · 12–16 October
Brent −1.4%; WTI +3.2%; ULSD +2.4%; propane +11.5%; EU LNG +9.1%
On 14 October the IEA assessed that gasoil would remain in deficit in Q4, and that a rebuild of stocks beyond seasonality was unlikely before the second half of 2027. On 16 October the EPA published a proposal to reallocate additional small refinery exemptions (SRE).
This was the week in which the crude market stopped describing the cost of the whole complex. The relative strength of propane, ULSD and LNG pointed to product bottlenecks. Crude prices alone could therefore give a false sense of relief.
Week 4 · 19–23 October
Brent −3.6%; WTI +7.2%; ULSD +3.5%; jet +2.7%; EU LNG +5.3%
S&P Global described JKM rising to about 30 USD/MMBtu on winter purchases by buyers in North-East Asia. ULSD NYH reached its highest weekly average of the month, 5.2008 USD/gal. US distillate stocks fell to 102.824 mn barrels.
The spreads gave the most information: Brent lost ground, WTI and products rose, and gas in Europe and Asia became more expensive. For a trader, this meant that the direction of crude prices alone said less than regional and product relationships.
Sources: IEA OMR 14.10; Federal Register 16.10; S&P Global 22.10; EIA.
Retrospective · week 5
The end of the month brought LNG convergence and relief in distillates
At the same time, propane kept rising and Henry Hub weakened markedly
Week 5 · 26–30 October
Brent +0.1%; ULSD −8.5%; jet −3.4%; propane +3.6%; Henry Hub −12.4%; EU LNG +9.3%
ACER raised its EU LNG assessment to an average of 92.54 EUR/MWh. According to JOGMEC, on 30 October JKM stood just above 34 USD/MMBtu and TTF at 34.0 USD/MMBtu. US distillate stocks fell to 99.259 mn barrels, and propane ended the month at 1.285 USD/gal.
The fall in ULSD did not mean a normalisation of the balance, because it came with stocks falling further. JKM–TTF convergence limited destination arbitrage for LNG. Henry Hub remained cheap, but the export value of US gas required a working liquefaction plant and an available vessel.
The signal was stocks, delivered prices and confirmed flows. The noise was the attempt to explain the whole month by a single move in Brent. The greatest divergences persisted where a product required specialised infrastructure or certification.
Signal and risk of interpretation
| Assessment | Observation | Significance |
|---|---|---|
| Signal | Distillates below 100 mn bbl | the physical US buffer was shrinking despite the price correction |
| Signal | JKM ≈ TTF | the LNG destination premium was small at the end of the month |
| Signal | Propane rose by 41.4% | LPG kept its own balance and logistics |
| Risk of interpretation | Henry Hub very cheap | it is not the price of LNG after liquefaction, freight and regasification |
Sources: ACER; JOGMEC 2.11; EIA weekly stocks and daily spot.
Crude, balance and OPEC+
The average crude price was high, but the weekly trend faded
The global balance remained in deficit, and the regional Atlantic premium was exceptionally high
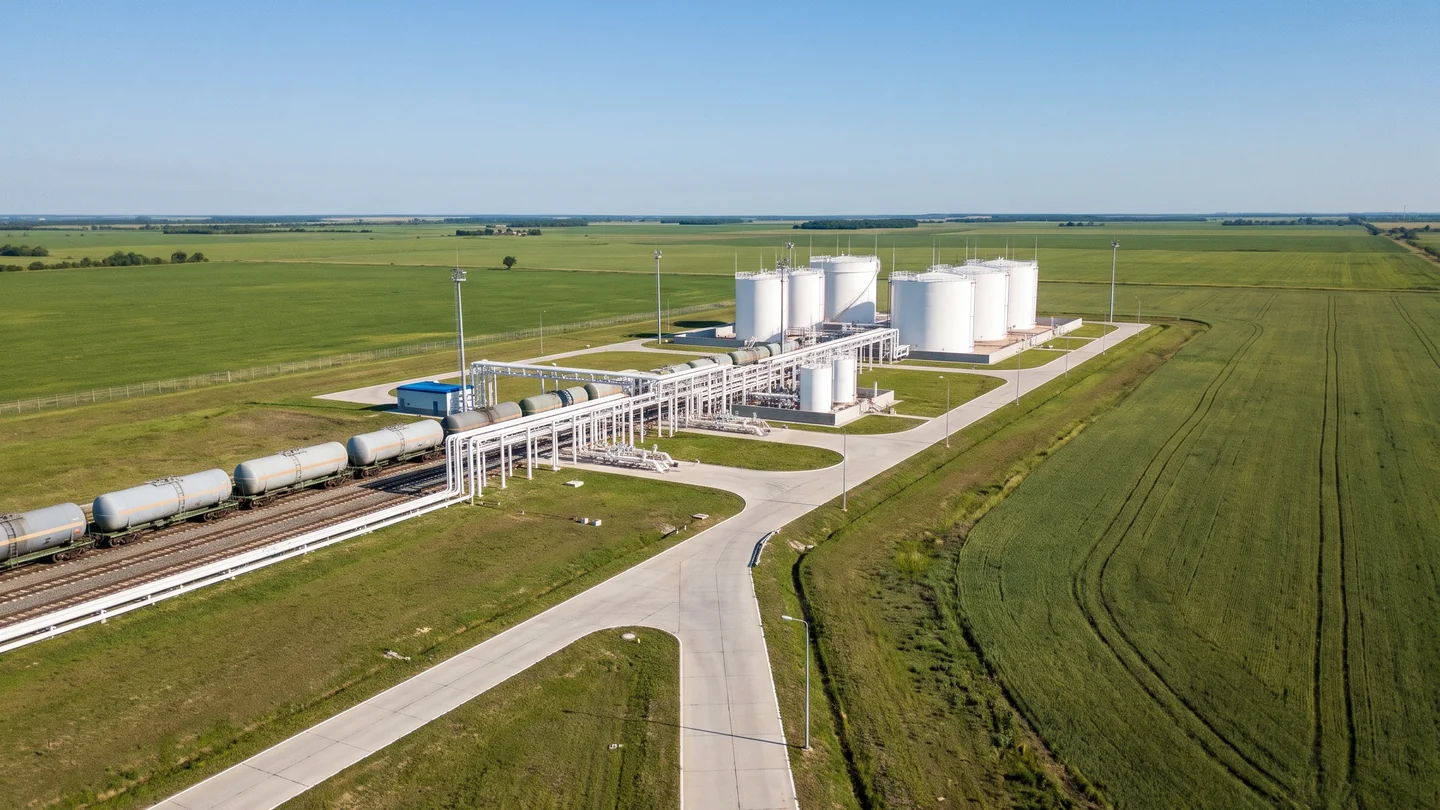
Europe paid a clear premium over WTI
In its October STEO the EIA estimated world production in 2026 at 101.1 mn b/d and consumption at 102.4 mn b/d. The forecast stock draw was 0.7 mn b/d in Q4. In the middle of the month, however, the IEA indicated that September supply had risen by 2.5 mn b/d to 102.3 mn b/d, mainly thanks to Gulf producers.
On 4 October OPEC+ maintained the required production level for seven participants for November. On 12 October the group again emphasised its stabilisation mechanisms. The statements limited expectations of sudden additional volume, but did not halt the gradual improvement in physical flows.
On 8 October S&P Global assessed the WTI MEH arbitrage to Rotterdam at 19.99 USD/b. The same crude had a negative netback to Singapore and North-East Asia: −17.01 and −19.77 USD/b respectively. Europe was therefore the natural direction for the marginal US barrel, provided that freight, quality and delivery date remained covered.
A wide Brent–WTI spread was information about geography and logistics, not an automatic profit. The transatlantic window was confirmed by an industry netback; the window to Asia remained closed.
Sources: EIA STEO 6.10; IEA OMR 14.10; OPEC 4 and 12.10; S&P Global 8.10.
Diesel and distillates
Crude gets cheaper, distillates remain expensive
Falling stocks and high freight kept the cost of product above the level implied by crude prices

Distillates: the price rose, stocks fell
The IEA reported that global diesel exports in September were 700 kb/d lower y/y, and that the loss from Russia and the Middle East totalled 1.3 mn b/d. In Q4 gasoil supply is expected to remain below demand, despite the anticipated increase in refinery runs by the end of the year.
Product deliveries from the Middle East recovered more slowly than crude flows. The IEA estimated September shipments of refined products at 1.9 mn b/d, against 4.7 mn b/d before the war. This limited the scope for quickly passing an improvement in crude supply through to the diesel market.
India gained in value as a flexible supplier. S&P Global reported that September middle-distillate exports reached almost 740 kb/d, and that early-October loadings remained high. Europe and the Mediterranean basin attracted a larger share of cargoes, but the cost of clean tanker freight remained a significant barrier.
A formula based solely on Brent understates the risk attached to diesel. Separate monitoring is needed of the crack, of stocks in the receiving region, of MR availability and of 10 ppm quality.
Sources: IEA OMR 14.10; EIA stocks; S&P Global 7, 13 and 22.10.
LPG and propane
Propane did not follow crude
Rising exports and shrinking stocks sustained the Mont Belvieu premium

LPG: the price rises as the buffer shrinks
The Mont Belvieu spot price rose from 0.909 USD/gal on 1 October to 1.285 USD/gal on 30 October. The weekly average rose in each successive week. At the same time, propane and propylene stocks shrank from 107.846 mn barrels on 2 October to 104.108 mn barrels on 30 October.
The EIA reported that US propane exports averaged 2.0 mn b/d in the first half of 2026, 11% more y/y, and reached a record 2.1 mn b/d in April. Terminal expansion is set to add about 300 kb/d of capacity, but it also increases the market’s dependence on terminals, slots and the VLGC fleet.
The IEA estimated September LPG shipments from the Middle East at 670 kb/d, against 1.5 mn b/d before the war. Lower LPG availability from the Gulf and record US export supply supported global demand for Mont Belvieu propane.
A potential US–Asia arbitrage requires confirmation of the Mont Belvieu–FEI/CP difference after VLGC freight, terminal fees and losses. A rise in the US price alone does not prove an open window; it does, however, show that the export market was effectively drawing in the surplus.
Sources: EIA Today in Energy 1.10, spot and stocks; IEA OMR 14.10.
LNG and gas
US gas cheap, delivered LNG expensive
Europe and Asia competed for the same flexible Atlantic cargoes

LNG: prices in Europe and Asia converged at 34 USD/MMBtu
ACER’s LNG assessment rose from 69.692 EUR/MWh on 1 October to 97.170 EUR/MWh on 30 October. ACER indicated that EU hub prices approached 90 EUR/MWh in the middle of the month, and that the conflict in the Middle East had raised the estimated gas import bill by EUR 18–33 billion.
JOGMEC reported that JKM rose from just above 25 USD/MMBtu at the end of September to well above 31 USD/MMBtu on 23 October, and then to just above 34 USD/MMBtu on 30 October. TTF ended the month at 34.0 USD/MMBtu. With such convergence, a flexible cargo had no obvious destination premium.
Henry Hub remained considerably cheaper, but it is not the price of delivered LNG. An export netback must take account of the liquefaction fee, fuel use, freight, boil-off, regasification and contract restrictions. The Freeport LNG outage and the risk to Norwegian deliveries were a reminder that cheap feed gas is not enough without a working supply chain.
At the end of the month, the LNG market offered freedom to choose the destination rather than a pure arbitrage. The value of a contract lay in the right to change port and date, not in a permanent JKM premium over TTF.
Sources: ACER; GIE; JOGMEC 29.10 and 2.11; S&P Global 19, 22 and 27.10.
Gas storage
Europe filled its storage, the US had cheaper gas
The storage level does not determine the price of the current cargo
Two gas buffers, two different pictures
EU storage ended October at about 74.6%, against about 71.6% at the end of September. The increase of about 3 percentage points improved the buffer, but did not halt the rise in prices. ACER emphasised the unfavourable winter–summer spread and competition with Asia for spot LNG.
In the US, working gas rose from 3,415 Bcf on 25 September to 3,724 Bcf on 23 October. The latest report showed stocks 38 Bcf, or 1.0%, above the five-year average, but 147 Bcf below the level a year earlier.
The contrast explains the fall in Henry Hub alongside the rise in European LNG. The US had rising stocks and strong production, while Europe paid for transport, liquefaction and rivalry for the cargo. Regional storage is a buffer, but it is not interchangeable without export infrastructure.
The fill level should be read together with the pace of offtake, contracted regasification, interconnections and sensitivity to temperature.
Sources: GIE AGSI+; ACER 27.10; EIA WNGSR 29.10.
Jet fuel and aviation
Fuel costs are rising faster than air traffic
Jet fuel remained part of a tight distillate complex

Jet fuel rose in price until the fourth week
The average USGC jet fuel price rose through the first four weeks of the month, reaching 4.6226 USD/gal in the week of 19–23 October. In the final week it fell by 3.4%, to 4.4636 USD/gal, but stayed above its level at the start of the month.
Jet fuel stocks in PADD 3 rose from 13.407 mn barrels on 2 October to 14.875 mn barrels on 30 October. Net production fluctuated between 1.016 and 1.077 mn b/d. The improvement in the local buffer helped the final correction, but the global distillate shortage continued to sustain price risk.
On 1 October Platts launched SAF assessments for the US Gulf Coast and a Brazilian import parity assessment. This increases contract transparency, but does not remove differences in feedstock qualification, emissions intensity, environmental credits and certification costs.
Hedging crude alone does not cover the jet/diesel spread, local basis or the premium for qualified SAF. The basket should reflect the actual purchase formula.
Sources: EIA spot, stocks and production; S&P Global/Platts 1.10.
Biofuels and SAF
The mandate creates demand, but the value of the environmental credit remains volatile
October brought new uncertainty around the allocation of the RFS obligation
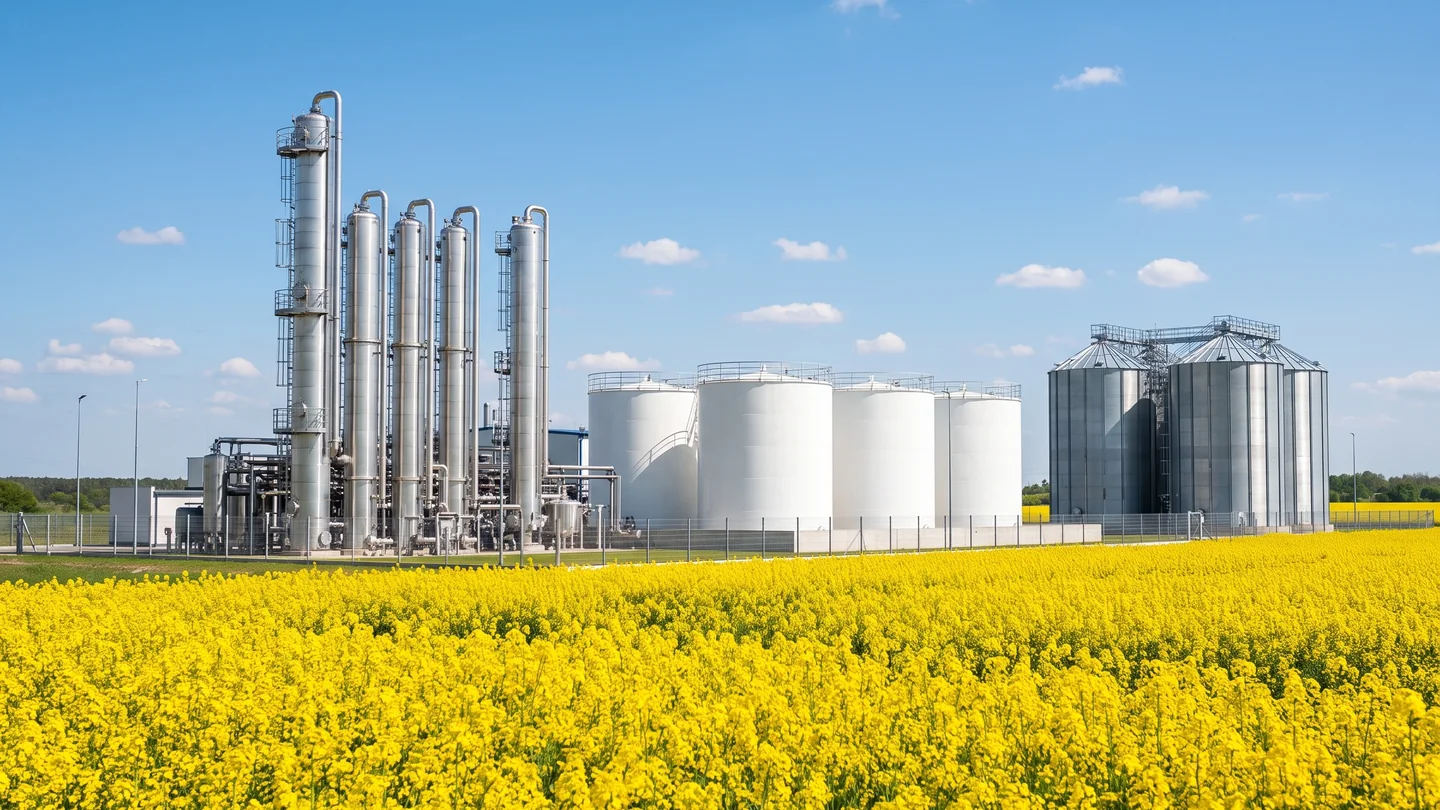
Biofuels: volume grows, regulation changes the distribution of risk
For Q4 the EIA forecast 0.27 mn b/d of renewable diesel, 0.11 mn b/d of biodiesel and 0.05 mn b/d of other biofuels, including SAF, renewable heating oil and renewable naphtha. Full-year renewable diesel production is expected to reach 0.23 mn b/d, about 21% more than in 2025.
On 16 October the EPA proposed two options for reallocating about 770 million additional RINs arising from larger-than-assumed small refinery exemptions for 2025: a split between 2026 and 2027, or moving the whole amount to 2027. The agency did not change the previously set physical volumes of 24.02 and 24.46 billion RINs.
For international trade, the key issue remains the loss or retention of the value of support schemes. The EIA indicated that in the second half of 2025 the US exported about 50 kb/d of renewable diesel and other biofuels, mainly to Canada and Europe. Such a flow does not, however, mean that every cargo will meet the requirements of RED, RFS, LCFS or a national SAF mandate.
Biofuels arbitrage should be calculated after adjusting for RINs, tax credits, LCFS, carbon footprint, mass balance, certification and potential duties. A physical price without the value of the environmental attribute is incomplete.
Sources: EIA STEO tab. 4d; EIA 7.05 and 10.06; EPA 27.03; Federal Register 16.10; Platts 1.10.
Regions: supply by product
Supply has to be read product by product
A surplus of crude or gas did not mean a surplus of diesel, jet fuel or LPG
Regional supply by product group
| Group | N. Am. | Europe | Mid. East | Asia-Pac. | Lat. Am. | Africa |
|---|---|---|---|---|---|---|
| Crude | ++ | −− | ++ | −− | + | + |
| Petrol/naph. | + | 0 | − | 0 | − | −− |
| Diesel | + | −− | −− | + | −− | −− |
| Jet | + | − | − | 0 | − | −− |
| VLSFO | 0 | + | − | 0 | 0 | − |
| Gas/LNG | ++ | −− | + | −− | 0 | 0 |
| LPG | ++ | − | −− | −− | − | −− |
| Bio/SAF | + | 0 | −− | 0 | + | −− |
Crude and runs. North America and the Middle East had the greatest capacity to deliver an additional barrel, although the recovery of flows from the Gulf remained fragile. Europe and Asia were structural importers of crude; actual availability was decided by freight and by how well the grade matched the refinery configuration.
Refined products. The deficit was widest in diesel and jet fuel. Products and LPG from the Middle East recovered much more slowly than crude. Asia’s export buffer was concentrated in India, South Korea and Singapore, while Europe, Latin America and Africa remained dependent on imports.
Gas, LPG and low-carbon fuels. The US remained the key source of flexible LNG and LPG, but terminals, the fleet and the Panama Canal limited the pace of growth in shipments. Biofuel supply was concentrated in North and Latin America; in Europe, physical availability did not equate to qualification under RED or a national mandate.
Sources: IEA OMR 14.10; EIA STEO and Today in Energy; ACER; S&P Global 29–30.09 and 8–22.10.
Regions: demand by product
Demand had a different geography from supply
The strongest demand was for distillates, winter LNG and LPG in Asia and on import markets
Regional demand by product group
| Group | N. Am. | Europe | Mid. East | Asia-Pac. | Lat. Am. | Africa |
|---|---|---|---|---|---|---|
| Crude | + | 0 | + | ++ | 0 | − |
| Petrol/naph. | 0 | − | 0 | 0 | + | + |
| Diesel | + | ++ | + | + | ++ | ++ |
| Jet | + | + | ++ | ++ | + | + |
| VLSFO | − | 0 | + | ++ | + | + |
| Gas/LNG | + | ++ | + | ++ | 0 | 0 |
| LPG | + | + | + | ++ | ++ | ++ |
| Bio/SAF | ++ | ++ | − | + | + | − |
Crude, petrol and naphtha. Asia remained the largest marginal buyer of crude, but expensive freight limited its ability to reach for Atlantic barrels. Demand for naphtha was weak, which the IEA linked to negative cracks; petrol was more regional and, after the summer season, gave no uniform global signal.
Diesel, jet fuel and VLSFO. Europe, Latin America and Africa competed for a limited pool of diesel. Aviation demand sustained purchases of jet fuel in North America, Europe, the Middle East and Asia. Singapore needed Western VLSFO components, but the level of freight decided whether the East–West spread translated into a cargo.
Gas, LPG and biofuels. Europe and Asia increased LNG purchases ahead of winter, and JKM and TTF converged at the end of the month. South Asia took up part of the growth in US propane exports. The strongest regulatory demand for biofuels and SAF remained in the US and Europe, while Latin America combined national mandates with a feedstock base.
Sources: IEA OMR 14.10; ACER 27.10; JOGMEC 29.10 and 2.11; EIA 1.10 and 7.05; S&P Global.
Arbitrage: crude and petrol
Crude: the Atlantic beat the Pacific
Petrol and naphtha remained more regional than crude

Global route map · Crude
| Direction: from → to | N. Am. | Europe | Mid. East | Asia-Pac. | Lat. Am. | Africa |
|---|---|---|---|---|---|---|
| N. Am. | – | N | M | Z | W | M |
| Europe | M | – | M | M | M | M |
| Mid. East | M | W | – | F | M | W |
| Asia-Pac. | M | M | M | – | M | M |
| Lat. Am. | F | W | M | W | – | M |
| Africa | M | W | M | W | M | – |
Global route map · Petrol/naphtha
| Direction: from → to | N. Am. | Europe | Mid. East | Asia-Pac. | Lat. Am. | Africa |
|---|---|---|---|---|---|---|
| N. Am. | – | M | M | M | W | W |
| Europe | W | – | M | M | W | W |
| Mid. East | M | W | – | F | M | W |
| Asia-Pac. | M | M | M | – | W | W |
| Lat. Am. | M | M | M | M | – | M |
| Africa | M | M | M | M | M | – |
Crude. On 8 October the published WTI MEH netback from the US Gulf Coast (USGC) to Rotterdam was +19.99 USD/b. The same crude to Singapore and North-East Asia gave −17.01 and −19.77 USD/b respectively. USGC → Europe therefore receives status N, and USGC → Asia-Pacific status Z.
Petrol and naphtha. The Atlantic → Latin America/Africa and Middle East → Asia corridors are structural, but public sources did not give a comparable October netback for all relationships. A status of W or M is therefore a signal to calculate, not a declaration of an open margin.
Sources: S&P Global 8.10; IEA OMR 14.10; EIA; OPEC. Assessment of the remaining relationships: Danske Gas synthesis.
Arbitrage: diesel and jet fuel
Distillates had buyers, but freight decided delivery
Europe, Latin America and Africa competed for a limited pool of cargoes
Global route map · Diesel/gasoil
| Direction: from → to | N. Am. | Europe | Mid. East | Asia-Pac. | Lat. Am. | Africa |
|---|---|---|---|---|---|---|
| N. Am. | – | W | M | M | F | W |
| Europe | M | – | M | M | M | W |
| Mid. East | M | W | – | W | W | W |
| Asia-Pac. | M | F | M | – | W | W |
| Lat. Am. | M | M | M | M | – | M |
| Africa | M | M | M | M | M | – |
Global route map · Jet fuel
| Direction: from → to | N. Am. | Europe | Mid. East | Asia-Pac. | Lat. Am. | Africa |
|---|---|---|---|---|---|---|
| N. Am. | – | W | M | M | W | M |
| Europe | M | – | M | M | M | W |
| Mid. East | M | W | – | W | M | W |
| Asia-Pac. | M | W | M | – | M | M |
| Lat. Am. | M | M | M | M | – | M |
| Africa | M | M | M | M | M | – |
Diesel. Flows from Asia to Europe and from the US to Latin America were physically confirmed, but backwardation, MR rates, sanctions and voyage time limited the margin. The directions from USGC, the Middle East and Asia to Europe remain natural conditional routes.
Jet fuel. The geography of supply was narrower than for diesel. Asia and the Middle East could supply Europe, but long voyage times and competition from diesel for middle fractions raised the profitability threshold. The matrix therefore does not mark any direction as confirmed by a positive netback.
Sources: S&P Global 29.09 and 7, 13 and 22.10; IEA OMR 14.10; EIA. Danske Gas synthesis.
Arbitrage: VLSFO and LNG
VLSFO sailed to Singapore, in LNG the freedom of choice mattered
In both markets the cost of the route was as important as the difference between benchmarks
Global route map · VLSFO/fuel oil
| Direction: from → to | N. Am. | Europe | Mid. East | Asia-Pac. | Lat. Am. | Africa |
|---|---|---|---|---|---|---|
| N. Am. | – | M | M | M | W | M |
| Europe | M | – | M | F | M | W |
| Mid. East | M | M | – | W | M | W |
| Asia-Pac. | M | M | M | – | M | M |
| Lat. Am. | M | M | M | F | – | M |
| Africa | M | M | M | M | M | – |
Global route map · LNG
| Direction: from → to | N. Am. | Europe | Mid. East | Asia-Pac. | Lat. Am. | Africa |
|---|---|---|---|---|---|---|
| N. Am. | – | F | M | W | W | M |
| Europe | M | – | M | M | M | M |
| Mid. East | M | W | – | F | W | W |
| Asia-Pac. | M | W | M | – | W | M |
| Lat. Am. | W | W | M | M | – | M |
| Africa | M | F | M | W | M | – |
VLSFO. Western cargoes from North-West Europe (NWE), the Mediterranean basin and Brazil supplied Singapore. The East–West spread reached up to 152 USD/t, but high freight limited arrivals in the first half of the month. The physical flow was visible, but the margin remained dependent on the day of loading and the blending component.
LNG. US → Europe, Middle East → Asia and Africa → Europe are confirmed corridors. At the end of the month JKM was close to TTF, so the value of the Atlantic → Asia route came mainly from the freedom of choice, not from a lasting destination premium.
Sources: S&P Global 30.09 and 22.10; ACER 27 and 30.10; JOGMEC 29.10 and 2.11; IEA. Danske Gas synthesis.
Arbitrage: LPG and biofuels
USGC → ARA returns to the main LPG map
An active flow does not remove the need for a CIF ARA calculation; in biofuels the cost of the attribute is added
Global route map · LPG
| Direction: from → to | N. Am. | Europe | Mid. East | Asia-Pac. | Lat. Am. | Africa |
|---|---|---|---|---|---|---|
| N. Am. | – | F | M | F | W | W |
| Europe | M | – | M | M | M | W |
| Mid. East | M | W | – | W | M | W |
| Asia-Pac. | M | M | M | – | M | M |
| Lat. Am. | M | M | M | M | – | M |
| Africa | M | M | M | M | M | – |
Global route map · Biofuels/SAF
| Direction: from → to | N. Am. | Europe | Mid. East | Asia-Pac. | Lat. Am. | Africa |
|---|---|---|---|---|---|---|
| N. Am. | – | F | M | M | M | M |
| Europe | M | – | M | M | M | M |
| Mid. East | M | M | – | W | M | M |
| Asia-Pac. | M | W | M | – | M | M |
| Lat. Am. | W | W | M | M | – | M |
| Africa | M | M | M | M | M | – |
LPG – US → ARA/NWE. S&P Global indicated that in September Europe took 12 mn barrels of propane from the US, and that average Houston–NWE VLGC freight was 31.27 c/gal, against 30.71 c/gal in August. The corridor is therefore physically confirmed. An open arbitrage, however, requires CIF ARA to cover Mont Belvieu, the FOB USGC premium, the terminal, VLGC freight, losses and financing.
LPG – other directions. US → Asia is also a confirmed flow; Middle East → Asia remained conditional because of limited supply. Latin America and Africa were potential destinations from USGC, but public sources did not make it possible to confirm a positive October netback.
Biofuels and SAF. US → Europe has a confirmed flow, but the value of RINs, LCFS, RED, carbon footprint, certification and duties can completely change the result. The remaining relationships are therefore marked W or M, even where physical trade in feedstock or fuel exists.
CIF ARA − [Mont Belvieu + FOB USGC premium + terminal + Houston–NWE freight + losses + financing + time risk] = margin after delivery.
Sources: S&P Global 14.10; EIA 1 and 30.10 and data on exports to the Netherlands; EIA 7.05; EPA; Platts 1.10.
Commercial conclusions
October rewarded the spread, not the direction of the price alone
Five lessons from the perspective of risk management
- Crude ≠ productThe fall in Brent did not automatically lower ULSD, jet or LPG.
- Stocks matter more than the narrativeDistillate stocks fell below 100 mn barrels despite the final price correction.
- Geography has a priceWTI had value to Rotterdam, but not to Asia.
- Freedom of choice in LNGA JKM–TTF spread close to zero increased the value of the right to change destination.
- The biofuel attributeRINs, emissions intensity and certification can be worth more than the physical spread itself.
Conditions that invalidate the conclusion
| Market | Condition | Mechanism |
|---|---|---|
| Atlantic crude | Spread closes | a rise in freight or a fall in the Brent/Forties premium over WTI MEH |
| Diesel | Stocks rebuild | a lasting rise in global exports and stocks, not a single price fall |
| LNG | JKM–TTF widens | weather or an outage creates a premium greater than the freight difference |
| LPG | Buffer grows | a reversal of the fall in US stocks or weaker petrochemical demand in Asia |
| Biofuels | Regulation changes | the final split of the SRE reallocation and the qualification rules change the value of RINs |
October’s commercial value lay in the ability to change source, route and destination.
First the physical balance and delivery constraints; then the spread; only at the end the direction of the price. This order limits the risk of mistaking a headline for a transaction.
Sources and methodology
Register of sources and methodology
Material titles are live links to the source pages
Register of sources · prices, stocks and balances
Register of sources · policy and trade
How this issue was produced
Time frame. Events and prices cover 1–31 October 2026. Data published after the close of the month were used solely to confirm values for 30–31 October and are marked with their publication date.
Weekly averages. For Brent, WTI, ULSD, jet fuel, propane and Henry Hub, unweighted averages of daily EIA prices were used. The week of 1–2 October is short, and comparisons with it are indicative. ACER presents unweighted averages of daily EU LNG assessments.
Retrospective commentary. We first set out the observed prices, stocks and events. We then formulate a Danske Gas synthesis from a trader’s point of view. We do not attribute a whole move to a single cause if stocks, freight, weather and policy were acting in parallel.
Regions. The supply and demand matrices cover eight product groups. The assessment is qualitative and describes conditions at the end of October. It combines quantitative data with information on flows and logistics; it is not an assessment of the credit risk of states or counterparties.
Arbitrage. The route map covers eight product groups and all 30 directions between six regions, i.e. 240 directional observations. N means a published positive netback for the day indicated; F – an observed flow, but not a confirmed margin; W – a conditional route; M – monitoring; Z – a published negative netback; and the sign ‘–’ a marginal direction. Every status other than N requires a check of current PRA prices, freight, terminal, quality, sanctions, financing and regulatory attributes.
Biofuels. Physical comparisons do not automatically include RINs, LCFS, tax credits, RED, CORSIA or national mandates. An environmental attribute may not be transferable between jurisdictions.
Limitations. The report is based on public sources and does not contain licensed PRA series. It does not constitute an investment, trading, tax or legal recommendation.
A fact has a date and a source. A conclusion has a mechanism and an invalidating condition.Danske Gas Research standard